Download the full article…
Disclaimer
The goal of this article is not to enter into the details of weapon system performances or try to explain how it works on a physical level because the elements at play, such as Radars, Datalink performance, guidance systems, software …are extremely complex.
This document is about presenting for BMS PLAYERS, in the simplest way possible, the model BMS has implemented in 4.37.3, in particular the newly implemented target acquisition model.
In no way is BMS pretending the AIM120 modelling (FM / Seeker / Acquisition method) is simulated accurately. It has been created with a lot of rough assumptions and guesstimations. This is a model developed for a video game that tries to mimic some of the published capabilities and behaviors of the real missile. It is therefore simplified modelling of an extremely complex domain of the Aerospace and research industry.
As a result, this document is highly criticisable from a technical and scientific point of view. It should never been taken as reference for any serious matters outside of gaming entertainment.
All data used to produce the BMS 4.37.3 model is in the public domain and referenced in this document.
Introduction
Since the release of Falcon 4.0, though improved over the years with the concept of HPRF and MPRF acquisition stages, the AIM120 acquisition model remained very simplistic.
One of the main issues of the original modelling is that the Target selected at launch with the FCR was automatically transmitted to the Missile seeker for HPRF and MPRF phases. If the target was within the seeker FOV (and with positive closure speed for HPRF) at the end of the Datalink Phase, then the target was automatically acquired by the seeker and the missile was then guided autonomously. There was therefore no real search or acquisition by the missile seeker other than FOV, not even range / SNR or any radar calculations. The initial FCR target was also ALWAYS the final acquired target.
A lot of effort and research has been done to try to change this ultra-simplistic model into something more acceptable and interesting from a gameplay point of view. The initial model change was introduced with 4.37.0 , with its wagonload of bugs and inconsistencies and has then been refined over subsequent releases.
Acquisition Phases
According to [1], the AIM120 can be launched in 4 different modes (at least in the F/A 18):
- The preferred launch mode is the Command Inertial mode, in which the missile receives targeting instructions from the aircraft through the use of an RF data link which provides updates every 0.5 to 1 second, depending on the launch mode of the aircraft radar.
- Inertial Active is a complete launch and leave mode in which the AMRAAM guides to an inertial point provided to the missile pre-launch with no updates during flight.
- The missile can also be launched in a home on jam mode in a noise jamming environment.
- The missile can also be launched in a visual mode when no radar targeting is provided to the missile.
BMS models (1) as default and (4) aka Maddog Launch.
(2) and (3) are not currently? modelled in BMS,
In BMS, some HOJ capabilities are possible in the (1) mode, though this is unknown if this modelling is close to real or not.

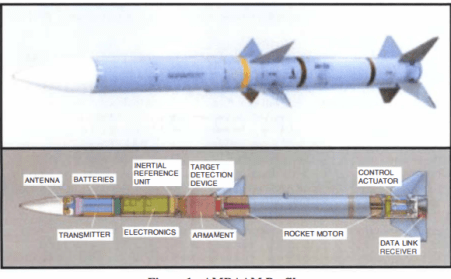
The AIM120 goes through 3 main phases during its flight (see Figure 1)
The MIDCOURSE : missile is receiving, via Radio Frequency Datalink, information on the target from the launching aircraft.
The HANDOVER, also known as search phase , starting with HPRF search then MPRF search (see Chapter 8 ). During this phase, the missile searches for a target with its own onboard radar. ” It is capable of sorting multiple targets and picking individual targets for each missile launched against an unresolved group of targets”. [1]
The TERMINAL : Terminal guidance is provided by the missile’s onboard radar.
The Uncertainty Volume
According to [1] :
“The design of AMRAAM makes it very dependent on the quality of targeting information provided by the host aircraft. The requirement for the missile to be very selective, in other words to hit only the desired target and not one in close proximity, forces the missile to follow instructions from the host aircraft very carefully. Targeting information is provided by way of a one-way Radio Frequency (RF) data link that provides the missile with target information. Since the missile very closely follows host radar instructions, bad instructions will significantly reduce the effectiveness of the missile. Electronic jamming can cause significant degradation to the tracking ability of the host radar and thus degrade the quality of the targeting data passed via the data link. The AMRAAM searches a volume, known as the uncertainty volume, around the data link provided point.”
The ”Uncertainty Volume” is the Volume that will be searched by the missile’s seeker at HPRF and MPRF phases. It is one of the key modelling aspects.
This is where we must introduce the concept of errors in the chain of the system. Several errors are piling up during the process, some of which can be identified:
The Radar accuracy:
- reference [3] “Accuracy is the degree of conformance between the estimated or measured position and/or the velocity of a platform at a given time and its true position or velocity.“
- reference [2] “The primary function of the radar data link is to provide angle, position and velocity information of the target to the missile. Errors in measurement and transmission of position and velocity represent the stochastic nature of radar performance”
The radar by nature is prone to errors in measurements in bearing / elevation / range and velocity information (based on rates in angles deviations and rates in range).
The Datalink:
reference [2] “Errors in measurement and transmission of position and velocity represent the stochastic nature of radar performance”
The INS: both the aircraft and the missile are equipped with INS, those systems also have errors and deviations and of course build in errors because the position of the target for the missile is know FROM the position of the aircraft, everything being relative, the INS errors will introduce errors in the Target information.
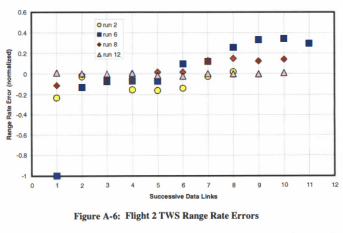
All those errors are building up in the evaluation of the position, range, speed and heading of the target , all of them are of a stochastic nature, which means they are not deterministic. In other words, one missile could have absolutely perfectly accurate target information while the same missile fired with the exact same Radar, target, external conditions would have a total different target information accuracy.
Figure 3 exhibits the stochastic nature of the Range Rate , same Flight test, several runs in the AMRAAM Hard-Ware In the Loop (HWIL) Simulation [2] , note the different deviations in the range rate Error between the runs and even during the same run between the successive Datalinks messages.
What does it mean In practice ? It means that the missile is receiving information on the target, let’s call this information “Data Link Provided Point” (DLPP) and will guide to it. In reality, depending on the errors that are built in, the DLPP could be in a different place to the TARGET (T).
However, because the missile “is aware” that DLPP is not the Target , it will “search” the Uncertainty Volume (UV) and will run a target selection only in the UV:
“The AMRAAM searches a volume, known as the uncertainty volume, around the data link provided point [1].”
It is a vital question to estimate as accurately as possible the uncertainty volume, because as stated in [1] “The requirement for the missile to be very selective, in other words to hit only the desired target and not one in close proximity…” the missile needs to be selective.
The Normal Distribution Model
Before entering into the BMS modelling, we need to talk statistics.
As seen, the errors build in the whole process are of stochastic nature.
The most common approach to the situation is to use normal distribution, also known as Gaussian Distribution [4]
The normal distribution is characterized by the “µ” which represents the mean expectation of the distribution and by σ which represents the “standard deviation”. Once we have determined the µ and σ of our whole process, then the normal distribution represents the percentage of chance for the value to be in some deviation (Figure 4).
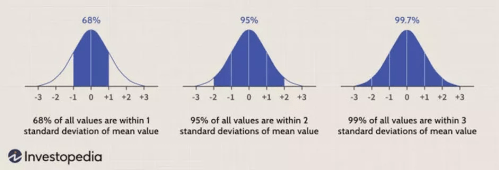
For instance, if the distribution for the RANGE deviation is (µ = 0 , σ = 200ft)
It means there are 68% of cases where the target will be within 200 ft, 95 % of cases where the target will be within 400 ft and 99.7% of cases where the target will be within 600ft
The BMS ERROR MODEL
The standard deviations
To date, the standard deviations of the whole process (Radar / Datalink/ INS / Others ? ) are unknown. We can make some assumptions, that are guesstimated but may not be too far off based on available data:
Unfortunately, the document Ref [2] uses only normalized data, on purpose to mask real data. Those normalized data will serve their purpose later on in the process though.
Ref [3] gives some clues on some radars, some of them are military Search and Track, some of TWS capabilities like the BOR A 550, some of them are AESA radars like the GM 400
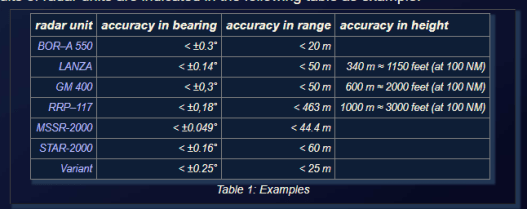
No data have been found on rates and thus target velocity errors so we had to estimate and hope we are not too far off.
At this stage, despite building in some errors in elevation it is for now unused and BMS models a uncertainty surface rather than uncertainty volume. It means the elevation of the target is always accurate for now. This could be activated in a later release if the current model proves to be robust.
It has to be noted that each FCR submode has a different error model build in. This is discussed in more detail in APPENDIX 1.
It is also to be noted that BMS does not model each error (Radar / DL / INS ) individually but considers the error of the whole system as one, so data might not directly compare with radar errors only. In other words , the standard deviation of the whole system is higher than radar alone.
At that stage all Radars / systems have the same standard deviation parameters. This can be configured for each radar in the radar data file. (Note : playing with those in your install will force BMS to spend time coding on anti cheat for multiplayer rather than spending time on bug fixes or new features so BEHAVE).

The implantation of the model and Uncertainty Volume
How and when are errors build in ?
As seen previously, the errors are different at every datalink message as indicated in [2] (Figure3 as example). It means in reality that the DLPP could be very close to the target at some point, and then, after a while, start to deviate significantly.
For now, BMS determines at launch the errors built in and applies a multiplication factor for random noise (µ = 1.0 , σ = 0.015) at each message sent. All data subject to stochastic deviation (azimuth , elevation, range, rates/speeds) has an independent random selection based on the gaussian model and the standard deviation ( Figure 6) and these will remain the same for the whole missile flight (modulo the noise).
As an example Figure7, at each launch in TWS , there is
- 68% chance that the DLPP vs Target range is less than 61m (200ft)
- 95% chance that the DLPP vs Target range is less than 122 m (400ft)
- 99.7% chance that the DLPP vs Target range is less than 183m (600ft)
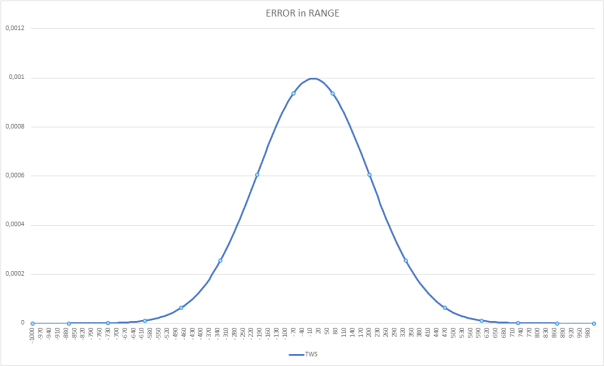
Same method is applied for angle deviation (azimuth) and rates / speeds.
The DLPP is therefore computed in real time, taking into account the real target position and speed , and apply to it the angular deviations , range deviation and rates deviation that have been “picked up” at launch.
Note that those angular deviations are always from the launcher perspective (because FCR is on the launcher), therefore the closer the launcher from the target, automatically the less position error in lateral.
Lateral Error ( Ft ) = range (ft) * sin (az_deviation)
As an example, let’s assume an azimuth deviation build in of 0.3 deg, the lateral position error will be 1272 ft at 40 NM , and only 477 ft at 15NM.
Effect of the Signal to Noise Ratio (SNR)
According to [4] , the SNR is acting on the range accuracy as a factor of

However, due to the uncertainty in the units of the SNR in falcon BMS code vs the source, for now the effect of SNR is only multiplying factor ranging from 0.9 for SNR of 1 ( in BMS code , if SNR is below 1, the target will be undetected) and clamped to 1.1 for a SNR of 4. This could be refined at a later stage.
Uncertainty volume
We are at a point in the model, where we have the AIM120 in Mid Course, flying to the DLPP that is regularly (every 0.5 to 1.0s [1]) updated by the FCR.
At some point during the Mid Course, the Missile will run a HPRF search and later on a MPRF search. (see chapter 8 for details). This search will be run in the Uncertainty volume (UV), any target within this volume will be considered as a potential candidate.
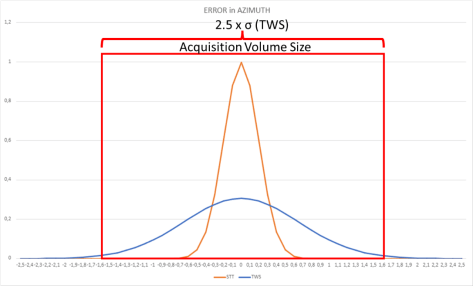
Figure 9 shows the angular deviation coverage of the UV (in red) compared with the models of angular deviations of the STT and TWS models (same will apply for range distribution)
Without any available information about it, the BMS UV coverage is based on 2.5 x σ of the TWS deviation models (see Figure 8), in other words, the UV will cover 2.5x the standard deviation of all stochastic errors.
UV SIZE | WIDTH | DEPTH |
| Range * sin (2 * 0,65) | 2 * 61 m = 122m |
– | – | – |
Range Launcher – Target at HPRF / MPRF |
|
|
15 | 648 m | 122m |
20 | 833 m | 122m |
25 | 1037 m | 122m |
30 | 1259m | 122m |
Note that because UV width is computed with range and azimuth, the closest the FCR is, the smaller the UV width will be (see Figure 9). The size of the UV at search is therefore dependent on the last DL message received with range information between launcher and target.
One big question mark is: should the UV coverage be dependent on the FCR SubMode as well (i.e. 2.5 x σ of each submode ) ?. It would make sense because that would increase the selectivity without impacting the Probability of guidance at all. However, at that stage, the UV coverage (and thus size) is independent of the FCR Submode i.e. the selectivity in all FCR Submodes is the same.
It might be changed in future release to increase selectivity of STT vs TWS.
Probability of Guidance
Uninterrupted Mid Course
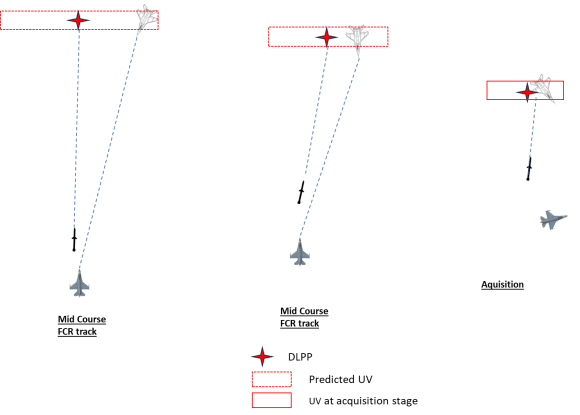
In this scenario, where the FCR track is kept until HPRF / MPRF, the BMS model outputs per construction:
- 100 % Probability of guidance in STT
- 98.7 % Probability of guidance in TWS
- Identical Selectivity between FCR sub modes
- The closer the Launcher is from Target at Acquisition, the better the selectivity
Wait wait, did we forget the Deviation in rates and Target Speed estimations?
As a matter of fact we didn’t forget them, but because the position of the DLPP is received at every DL message this does not play a role in Probability of Guidance when you keep the FCR lock until Acquisition phase.
Those target speed errors are however playing a role in the Guidance system. That is to say the missile might have a non-ideal trajectory to the DLPP during mid course.
In term of Guidance probabilities , the deviation in rates and speed only matter when you break the lock before HPRF/ MPRF search phase and that is the object of the next chapter.
FCR Track Lost during Mid Course
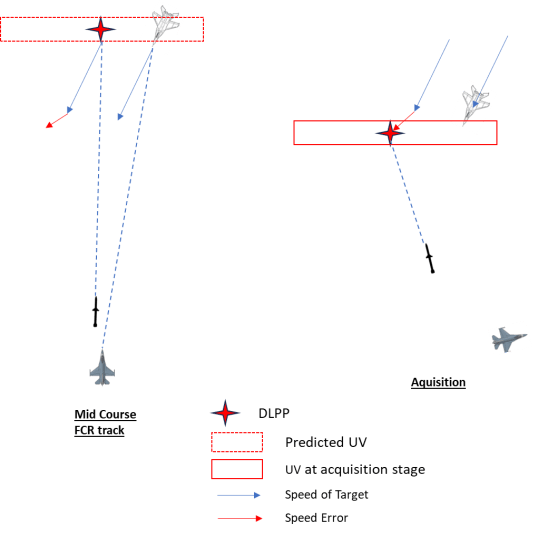
When the FCR contact is lost during MidCourse, the Missile does not receive any update anymore. The Guidance system enters into inertial guidance and the missile interpolates the DLPP from the last DL message received.
When at HPRF/ MPRF range from the interpolated DLPP , the missile enters a standard HPRF / MPRF search with an UV size corresponding to the last received DL message.
Non Maneuvering targets
Maneuvering targets
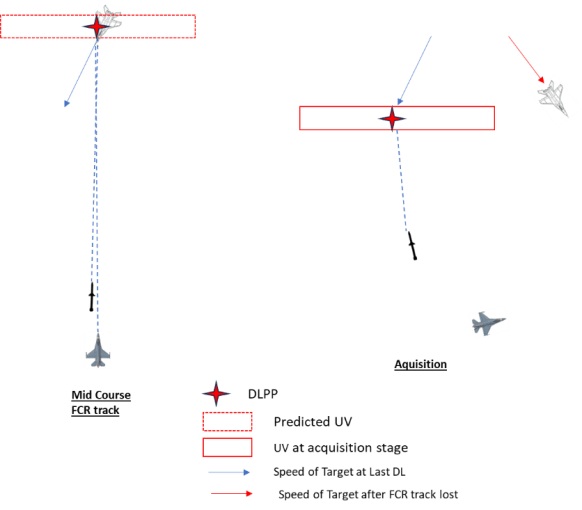
Against maneuvering targets, even if the process had no errors, the Probability of guidance is very reduced due to interpolated DLPP.
Conclusions
Estimating the Probability of Guidance when FCR Track is Lost during Mid-Course is complex due to the stochastic nature of the errors combined with the range at which the FCR track is lost and combined with target speeds and orientations.
This would be possible to compute some PG data but it would require a code routine that runs hundreds of simulated shots in various configurations. It is not in BMS scope for now.
It is however clear that the following statements apply when FCR track is lost mid-Course:
- The longer the DataLink is maintained, the higher the PG
- The more maneuvering the target, the lower the PG
- PG STT > PG SAM > PG TWS
- The longer the DataLink is maintained, the better the selectivity
FCR Track Lost during Mid-Course and HOJ
During Mid-Course, if the Target is Jamming, the Missiles recognizes it as a potential HOJ target.
In case the FCR track is lost, the missile is using the Jamming Signal from the target as reference to update the DLPP.
HOJ process has also errors build in as followed:

The PG in HOJ is therefore lower than any of the FCR tracks, however it remains much higher in case FCR track is lost, especially if target is maneuvering.
Handover / Acquisition Methods
Ref [2]
“AMRAAM performance is most sensitive to the last data link it incorporates into its guidance solution22 • Usually the last data link used by the missile is one of the last data links sent to the missile, but not necessarily the last data link. At a specific range based on several parameters, the AMRAAM stops incorporating data links received into its guidance solution”
We made the assumption that the AMRAAM stopped incorporating DL received after the MPRF search commences.
HPRF
When the missile range from DLPP reaches R_HPRF, a first search sequence is done for all contacts within AIM120 Seeker FOV
HPRF Target Selection Criteria:
- Are Dismissed:
- contacts outside the UV
- contacts with a SNR < 1
- contacts with a positive closure rate
- contacts with a positive aspect angle
- From remaining valid contacts, the closest from the DLPP is selected.
During HPRF search and guidance, the DL remains open to receive updates from the FCR.
Several scenarios are possible during the HPRF search / guidance phase
- If no target is found after HPRF search, the missiles continues flying to the DLPP (updated from the FCR if Target Lock is still active , or interpolated from last known DL message if the FCT target has been lost).
- If target is found after the HPRF search, the missiles is guided to the HPRF target
- If the HPRF Target has been acquired but is lost during the guidance phase (for instance the target goes cold):
- If DL from FCR is active, missile guides back on the DLPP updated from the DL
- If DL from FCR is no more active, missiles guides on Interpolated DLPP from last known HPRF target data.
MPRF
The Range of MPRF search (R_MPRf) is depending on the target selection size in the SMS.
When the missile range from DLPP (or from the HPRF target if any) reaches M_HPRF, a new search sequence is done for all contacts within AIM120 Seeker FOV
During MPRF search and guidance, the DL is dismissed, even if FCR maintains a valid target Track.
MPRF Target Selection Criteria:
If HPRF target is valid, the Seeker switches to MPRF and takes the HPRF target as MPRF target. No new search sequence is done
If no HPRF target, the missiles runs a search sequence for all contacts within its seeker’s FOV:
Are dismissed:
- contacts outside the UV
- contacts with a SNR < 1
- From remaining valid contacts, the closest from the DLPP is selected.
If no MPRF target is found, the missile will continue searching sequence based on the same target selection criteria as long as its range from the (interpolated) DLPP is more than 0.5NM. At less than 0.5NM from the DLPP, if no MPRF target have been found, the missile is lost.
CONCLUSION
Changing the AIM120 weapon system modelling from the ultra-simplistic Falcon 4.0 has been a real challenge. It has required a lot of researches, a lot of headaches and many litres of coffee.
Not only it was challenging to understand and guesstimate how the real weapon system could work, but it was also difficult to model from a code implementation point of view.
The first version of the new AIM120 acquisition code (4.37.0) was a partial success only, we tried to implement the consequences in term of PG , underestimating the stochastic nature of the process, rather than sticking to the causes and trying to model them the best we could with proper Gaussian distribution.
We also badly understood the concept of Uncertainty Volume, and made wrong assumptions about the HPRF/ MPRF searching criteria.
On the other hand, the stochastic nature of the model makes it very difficult to test as hundreds of scenarios are needed to start drawing statistically relevant conclusions.
We thank the BMS community to have tested the early versions of the new model, every time you guys reported a strange behaviour with Tacview or Repro cases, you helped us immensely to understand and fix the issues.
A lot of things can still be improved, for example, two AIM120 launching mode capabilities are yet in BMS but we are confident that the updated modelling included in 4.37.3, as explained in this document, will bring you many hours of interesting gameplay.
In conclusion, it also appears clear that increasing Weapon system accuracy and decreasing its susceptibility to jamming or Electronic attack is a domain that has probably very much improved over the years. It is very possible that (even without talking about more modern radars / systems), software updates make the Weapon system more accurate and that for the same radar and system, the PG have improved over the years.
That is why most of the parameters governing the weapon system can be read from every radar dat file or missile dat file, because BMS is the sim that refuses to die, one day some devs will model different weapon system accuracy and include more modern system capabilities.
APPENDIX 1
FCR SUB MODE ERROR MODELING
While discussing with real pilots, they have always been consistent in the fact that despite TWS was offering capabilities to track and guide on several targets in the same time, they always use STT as “preferred” guidance FCR Submode.
After some researches on the matter, the most relevant document about this is
Ref [2]“Optimization of Electronic Protection Testing for the F/A 18 active Guidance Air to Air Weapon system”
A Thesis Presented for the Master of Science Degree The University of Tennessee, Knoxville
Cassidt Clayton Norman Dec 2003
The document is relevant for BMS, because it is about the AIM120 combined with radars of the same generation than the APG68, namely the APG65 and APG73.
This thesis is basically investigating the effect of “EA” for Electronik Attacks on the Radar / AIM120 system.
Quote:
“In 1996, the US Navy funded the Weapon System Evaluation program, which includes EP testing of the F/A-18 and AMRAAM weapon system. Current test methods involve captive carriage of the AMRAAM against full-scale targets employing specific EA techniques. Radar data links to the missile are recorded in flight and replayed in the Hard-Ware In The Loop (HWIL) simulator to test missile performance during simulated missile intercept of the same EA threat. Twenty simulations are executed in the HWIL for each test flight to calculate missile probability of guidance (Po). For each HWIL simulation, 50 lethality simulations are executed to calculate probability of weapon effectiveness (PWE). Neither the table nor the chart includes uncertainty associated with the calculated probabilities.” (<= too bad for us…)
The document being in the public domain, it is masking a lot of information and does not even reveal the nature of the different “EA” techniques that have been tested.
The document also reveals that the uncertainties about PG were very high, at least at that time and that they tried to improve their knowledge by using several techniques and the NAVAIR Weapons Division China Lake F/A-18 radar laboratory
Quote:
“A closer look at the test methods revealed that only a few tests of aircraft radar are used to characterize aircraft radar performance versus the EA threat while thousands of simulations are used to characterize AMRAAM performance. For the average number of test runs of each radar mode, the uncertainty associated with the aircraft radar performance calculation was found to be± 43.6% while the uncertainty associated with AMRAAM performance calculation was found to be± 1.39% (using 95% confidence interval). The combined uncertainty is± 44.4%, which spans a wide range of performance for any calculation of PG or PWE.”
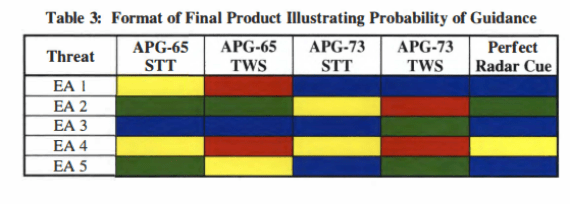
For the first time here, we can read that each radar mods were individually tested. This is the very first indication, that FCR subModes can have very much different PG. Why running hundreds of different tests for every FCR Submode if it was so obvious that results are identical?
The Table 3 of the document is more explicit, with a color code that reveals the PG of every radar and FCR Submode.
We must remain aware that this document is an example only and might, or might not, reveal any information about it. Moreover, it presents results against “EA” while in BMS we are more interested about results without “EA”.
The fact that TWS nearly always has a lower PG than STT might be a coincidence as well…but maybe not.
At that stage, it is clear however, that STT and TWS are not considered of the same performance by the HWIL (Hard Ware In the Loop) or the NAVAIR Weapons Division China Lake F/A-18 radar laboratory, else why bothering? Something is clearly at play in there!

ANALYSIS of the ERRORS and the RATE ERRORS
Reference is made to the APPENDIX A of [2]
In order to determine if the processes at play were stationary and ergodic, they performed / plotted a certain amount of test about Range Error and Range rate errors.
Unfortunately, the errors were normalized in order to mask for public the real errors of the weapon systems. However, what is interesting for us here are that the errors charts can be compared because they use the same normalization.
We also must keep in mind that all those tests have been done with Fighters applying “EA” techniques, unfortunately no tests are plotted as reference for non EA targets, unless maybe one of the flight is a reference? We will never know.
Anyway, we did a comparison of every chart of this document and tried to estimate if there was something consistent in the difference between STT and TWS.
If significant and consistent differences were found for so many runs and Flight cases, we could probably conclude that STT and TWS have different processes that makes them different in term of PG.
ERRORS IN RANGE
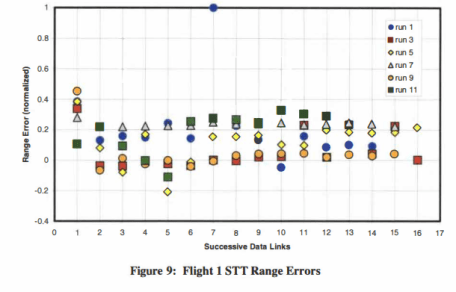
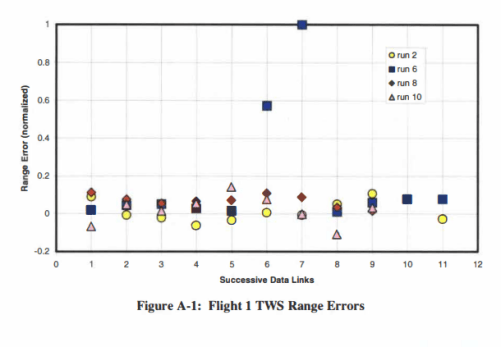
Flight 1 exhibits no significant difference between STT and TWS, but two singularities in TWS.
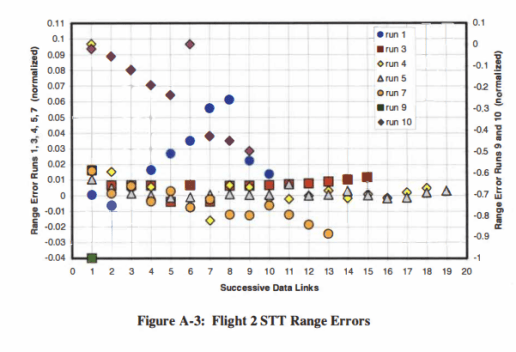
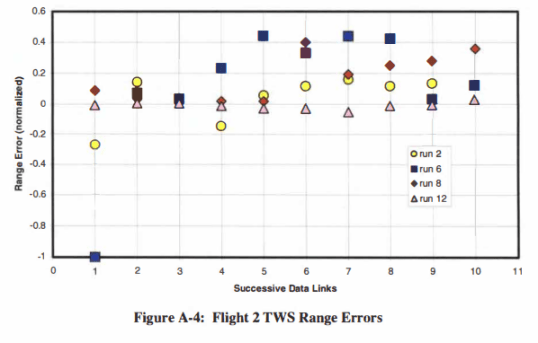
Flight 2 exhibits significant difference between STT and TWS
- Runs 1-3-4-5-7 (STT) being in the range of -0.03 and + 0.04
- Runs 9 – 10 (STT) being in the range of -0.04 and +0.1
- Runs 2 – 6 – 8 – 12 (TWS) being in the range if -0.25 and +0.45
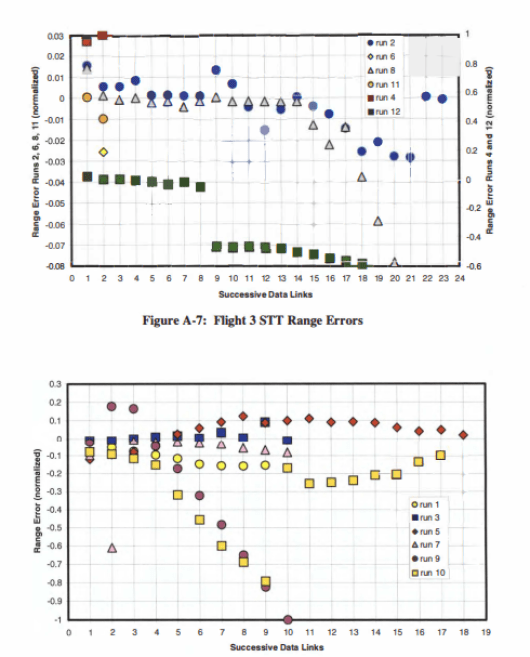
Flight 3 exhibits significant difference between STT and TWS
- Runs 2-6-8-11 (STT) being in the range of -0.08 and + 0.015
- Runs 4– 12 (STT) being in the range of -0.08 and +0.03 (and above ?)
- Runs 2 – 6 – 8 – 12 (TWS) being in the range if -1.0 and +0.2
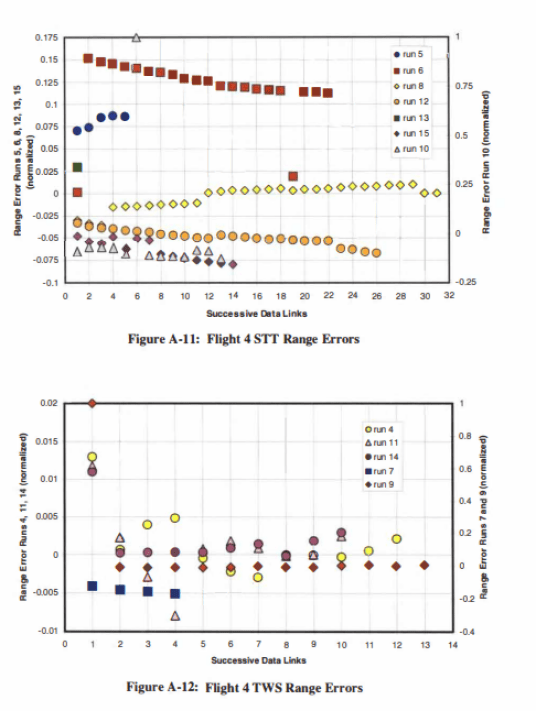
Flight 4 exhibits difference between STT and TWS
- Runs 5-6-8-12-13-15 (STT) being in the range of -0.05 and + 0.15
- Runs 10 (STT) being in the range of -0.10 to 0
- Runs 4 – 11– 14 (TWS) being in the range if -0.0005 and +0.0125
- Runs 7 – 9 (TWS) being in the range of -0.20 and +0
MEAN RANGE ERRORS
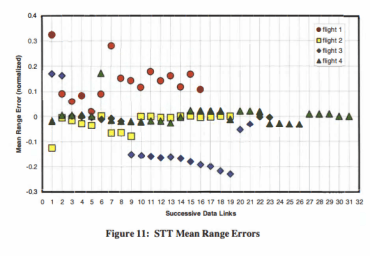
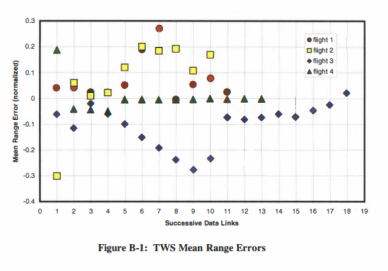
The assembly of all error ranges exhibits a mean Range error more widely spread in TWS than in STT, STT has 5 points (out of 31 DL Messages ) outside the -0.2 / + 0.2 interval while TWS has 10 points (OUT OF 19 DL messages) outside -0.2 / +0.2 interval.
We can conclude that STT has better performance than TWS as far as ranging accuracy is concerned.
ERRORS IN RANGE RATES
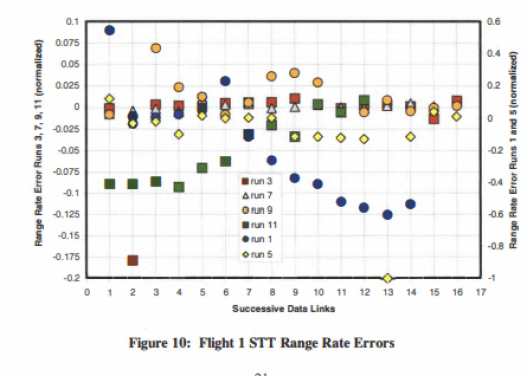
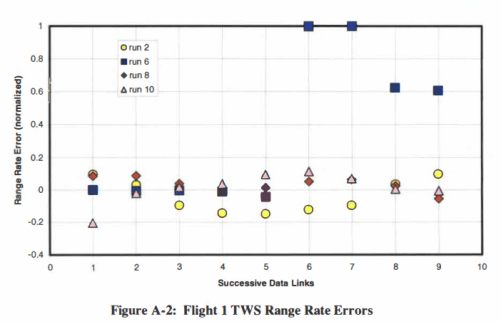
Flight 1 exhibits significant difference between STT and TWS
- Runs 3-7-9-11 (STT) being in the range of -0.1 and + 0.05
- Runs 1-5 (STT) being in the range of -0.60 to 0 .2
- Runs 2 – 8 – 10 (TWS) being in the range if -0.2 and +0.15
- Run 6 (TWS) being in the range if 0 and +1.0
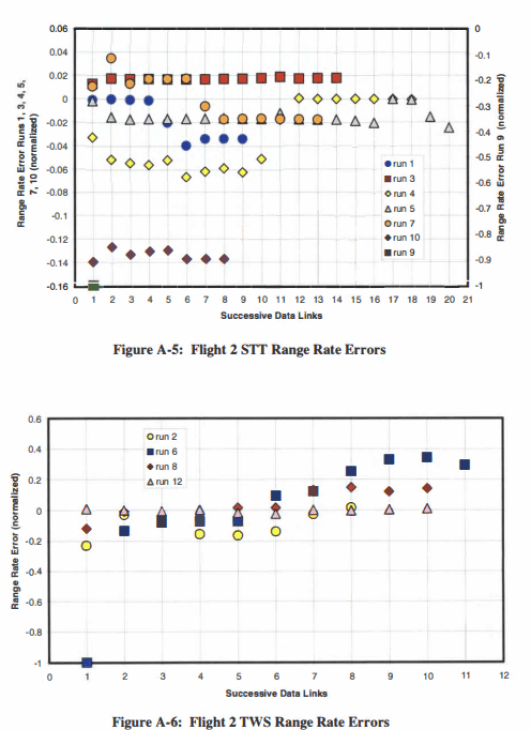
Flight 2 exhibits significant difference between STT and TWS
- Runs 1-3-4-5-7-10 (STT) being in the range of -0.16 and + 0.02
- Runs 9 (STT) difficult to analyse
- Runs 2 – 6- 8 – 12 (TWS) being in the range if -0.2 and +0.35
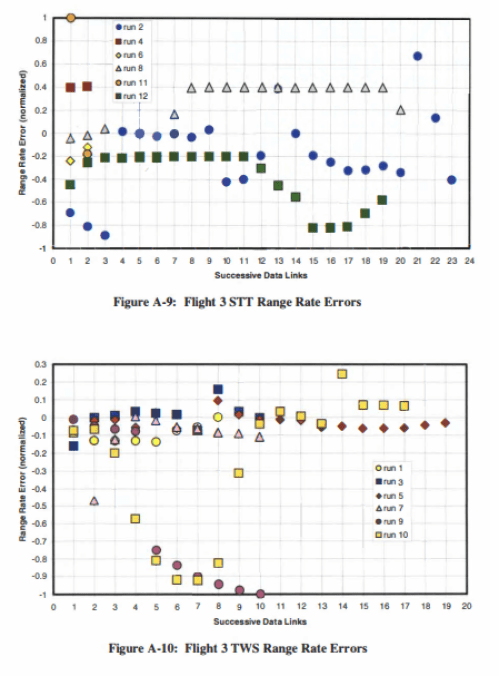
Flight 3 exhibits no significant difference between STT and TWS
- Runs 2-4-6-8-11-12 (STT) being in the range of -1.0 and + 0.4
- Runs 1 – 3- 5-7-9-10 (TWS) being in the range if -1.0 and +0.3
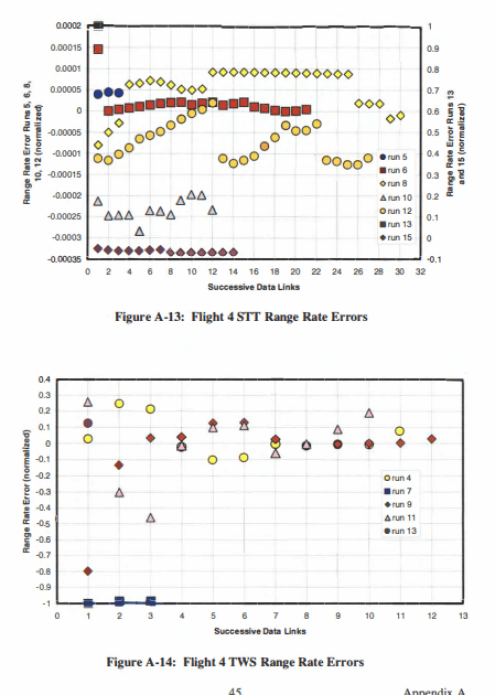
Flight 3 exhibits significant difference between STT and TWS
- Runs 5-6-8-10-12 (STT) being in the range of -0.0003 and + 0.0002
- Run 13 (STT) being in the range of -0.1 and +0.0
- Runs 4 -7-9-11-13 (TWS) being in the range if -1.0 and +0.25
MEAN RANGE RATE ERRORS
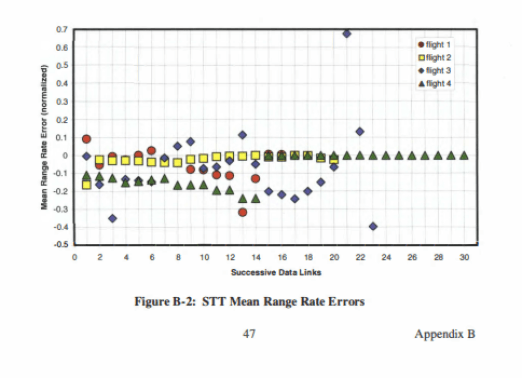
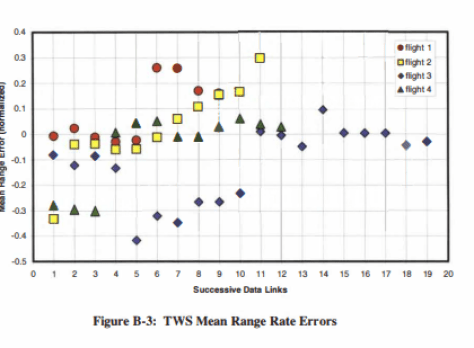
The assembly of all error ranges rate exhibits a mean Range rate error BIGGER (STT interval -0.4 / +0.1 – TWS interval -0.4 / +0.3) and more widely spread in TWS than in STT,
We can conclude that STT exhibits better performance than TWS as far as ranging rate accuracy is concerned.
OVERALL CONCLUSION OF FCR SUB MODE ERROR MODELING
What conclusions could we draw from all of this.
Thanks to [2], we have a glimpse of information that STT and TWS are not treated the same in the different professional analysis and simulations.
Data tends to suggest that STT provides better performance than TWS
This is the reason why we chose to model different errors in different FCR SubModes.
However, if you reached that point of the document, you remember that the UV in BMS Model is scaled on the TWS error model, therefore there is no major difference between TWS and STT if FCR lock is maintain.
The only real difference is that TWS rate / speeds being less accurate than STT, the PG will be lower in case FCR target track is lost.
References
[1] “Distribution Simulation Testing for Weapons. System Performance of the F/A 18 and AIM120 Amraam”
LCDR Tom Watson , Naval Weapons Test Squadron, Point Mugu CA
https://apps.dtic.mil/sti/pdfs/ADA355385.pdf
[2]“Optimization of Electronic Protection Testing for the F/A 18 active Guidance Air to Air Weapon system”
A Thesis Presented for the Master of Science Degree The University of Tennessee, Knoxville
Cassidt Clayton Norman Dec 2003
https://trace.tennessee.edu/cgi/viewcontent.cgi?article=6680&context=utk_gradthes
[3] Radartutorial.eu
https://www.radartutorial.eu/01.basics/Radars%20Accuracy.en.html
[4] Wikipedia: normal distributions

